Marketing ROI Metrics
The ROI numbers that hold up under a CFO's questions — and the ones that don't.
What this infographic is actually arguing.
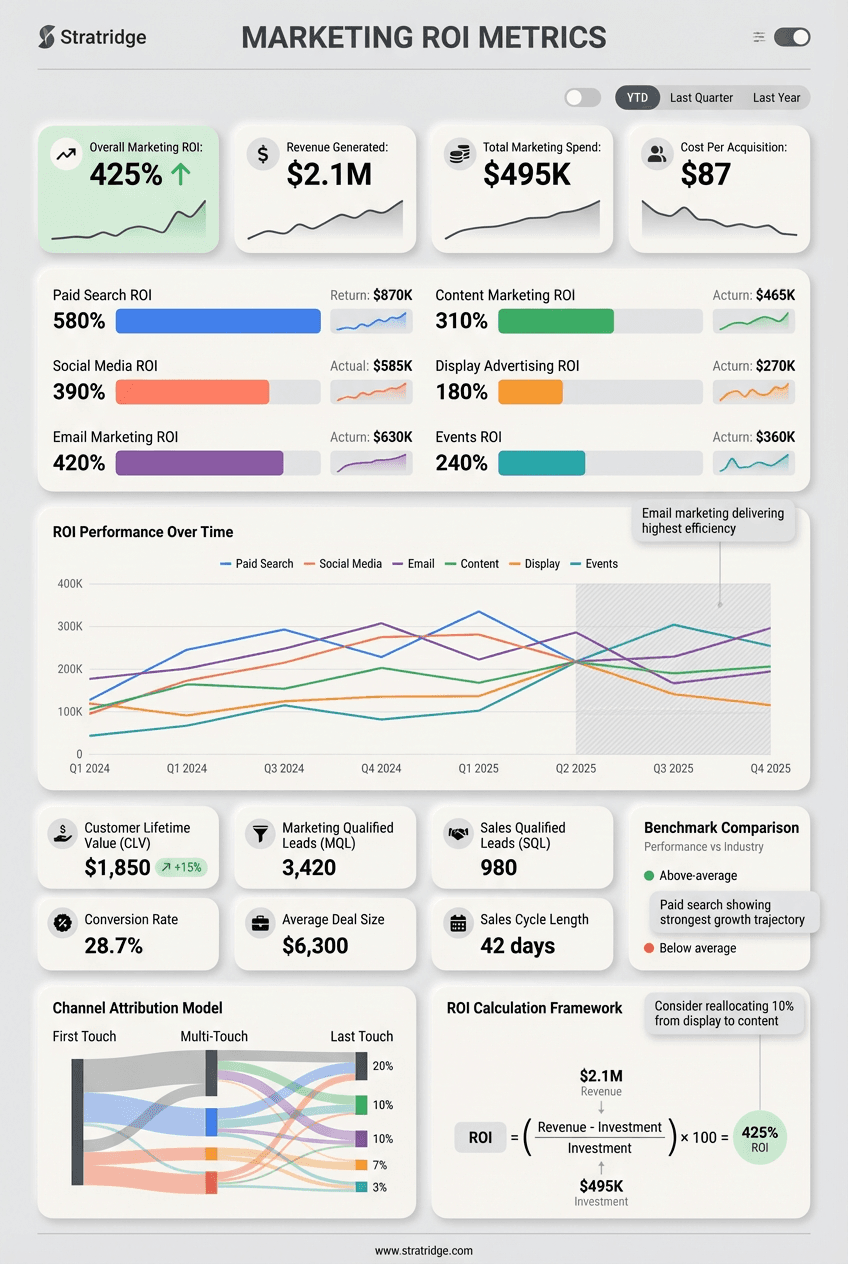
Marketing ROI is a favorite number in slide decks and a deeply unloved one in finance meetings. The reason is predictable: the inputs are fuzzy, the attribution is arguable, and the time-to-conversion for B2B deals makes single-quarter ROI math misleading. This infographic covers the metrics that hold up under pressure and the ones that only hold up in a vacuum.
The four that survive scrutiny: customer acquisition cost (CAC), customer lifetime value (LTV), LTV:CAC ratio, and payback period. CAC is fully-loaded cost of acquiring a customer, including all marketing and sales investment — not just paid-media spend, which is the most common way to make the number flatter than it should be. LTV measures the gross margin a customer contributes over their tenure, not revenue — using revenue over-states the picture for anyone with real COGS. The ratio of those two is the headline number most boards now ask for. Payback period tells you how long you're underwater on each customer, and it's the metric that catches an unsustainable growth motion before the LTV:CAC does.
Two metrics that look good and aren't: return on ad spend (ROAS) treated as a marketing efficiency signal, and MQL-to-SQL conversion rates measured in isolation. ROAS is useful for paid media optimization and useless as an enterprise-level ROI measure because it ignores the cost of everything that isn't paid. MQL conversion is useful operationally and useless strategically because it rewards volume over quality — a team optimizing MQL count can tank SQL rates and still look like they're hitting targets.
Use influence modeling, not single-touch attribution, for anything with a sales cycle longer than 30 days. Multi-touch models are imperfect but directionally correct; first-touch and last-touch are both wrong in ways that favor whichever stage you're personally responsible for.
The metric most B2B CMOs should be reporting to the board that they aren't: pipeline-influenced percentage. Of the pipeline in the current quarter, what percentage was marketing-touched at any stage? That's the number that tells finance whether marketing matters.
This infographic is free. The audit is too.
Paste your URL and Stratridge returns an audit graded against the six dimensions and twenty-four factors — so you see where the story on your site lines up with the story this infographic describes, and where it doesn't.