Customer Lifetime Value
Calculating LTV the way finance asks about it — and why the vanity LTV your marketing dashboard shows is wrong.
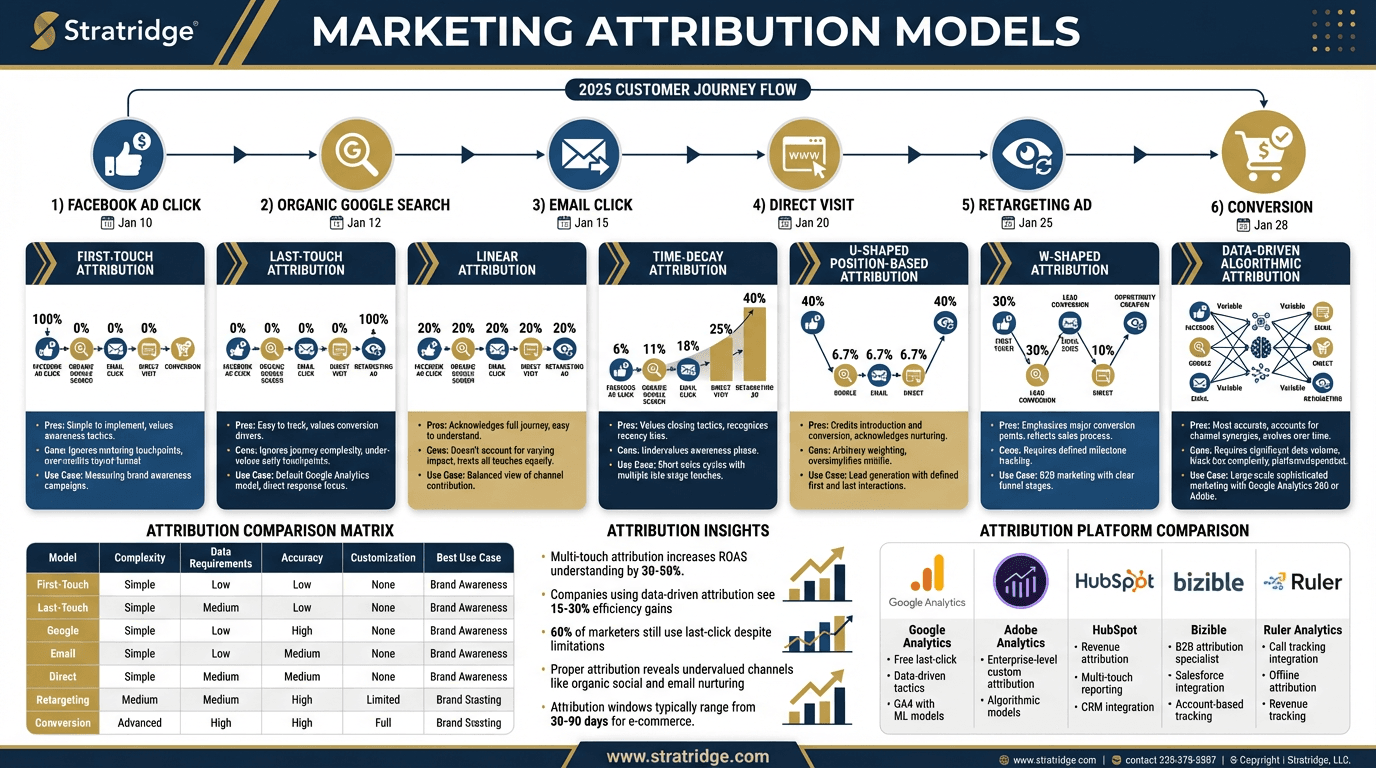
What this infographic is actually arguing.
Customer lifetime value is the metric most likely to be cited in a board meeting and least likely to be calculated correctly. The version your marketing dashboard reports is almost always wrong — usually wrong in the flattering direction — and the version finance uses is rarely the one marketing optimizes against. This infographic shows how to calculate LTV so it survives both conversations.
Start with gross margin, not revenue. Revenue LTV is the most common mistake. A $10K ARR customer at 80% gross margin is worth $8K LTV per year to the business, not $10K. Using revenue inflates LTV, inflates LTV:CAC, and makes unprofitable cohorts look like efficient ones. Always use gross margin, always net of churn, always on a cohort basis.
The cleanest formula: average revenue per account × gross margin percentage × average customer lifetime in years. Customer lifetime is where the math gets soft. The textbook approximation is 1 divided by annual logo churn rate, but this only works if churn is stable across the customer base. For a company with tiered customers — enterprise, mid-market, SMB — calculate LTV per tier, not averaged across. The average obscures the fact that enterprise customers often subsidize SMB economics, or vice versa.
Factor in expansion. For SaaS, net revenue retention (NRR) above 100% means cohort value grows over time. Pure churn math ignores this and under-states LTV. For an NRR-120 cohort, LTV is meaningfully higher than a straight churn-rate calculation suggests, and marketing can justify higher CAC against those segments.
The honest LTV calculation also has an expiration date. A three-year-old LTV calculation is probably wrong because the pricing changed, the ICP drifted, or retention moved. Rebuild quarterly at minimum.
The uncomfortable finding most CMOs encounter when they do this properly: the CAC:LTV ratio on their worst segment is negative once fully loaded with gross margin and allocated cost. Cutting that segment out of acquisition economics is the highest-leverage move in the whole marketing budget.
Stratridge's Positioning Audit often surfaces the tell — a site trying to serve three LTV tiers at once with one message.
This infographic is free. The audit is too.
Paste your URL and Stratridge returns an audit graded against the six dimensions and twenty-four factors — so you see where the story on your site lines up with the story this infographic describes, and where it doesn't.